No doubt it will be engrained in some peoples’ histories, due to such human experiences as first ‘hello’s or last ‘goodbyes’. However, even for these people, it may only be the dates, people and places that are memorable, whilst the changing daily ratio of summer’s raw ingredients (temperature, sunshine, rainfall etc) are as forgettable as how much milk they added to their tea or how long they left the tea bag in for.
It’s almost impossible to detangle the weather/climate from the human experience. Obviously, we all have slightly different preferences and thresholds of pleasure/pain. However, on the whole, it’s true to say that long, hot days make us wear fewer clothes, spend more times outdoors, stay up later, eat strange food at strange times in strange places, and simply be more available to new experiences. By contrast, coolness, darkness and wetness tends to drive us indoors, where routine reigns supreme and where life is generally more predictable and less agile. There’s no wonder that some summers are like memory making machines on steroids, and some summers are only remembered for being forgettable (until a short time later, when we have actually forgotten them).
However, here at Jersey Met, and indeed Guernsey Met and any other data gathering Climate Station around the world, no summer is left out. Every summer, even that of 2021, is an essential part of the record. A record that, after simple analysis, tells us what can realistically be expected at this time of year, in this part of the world, without rose tinted spectacles or any other form of human bias.

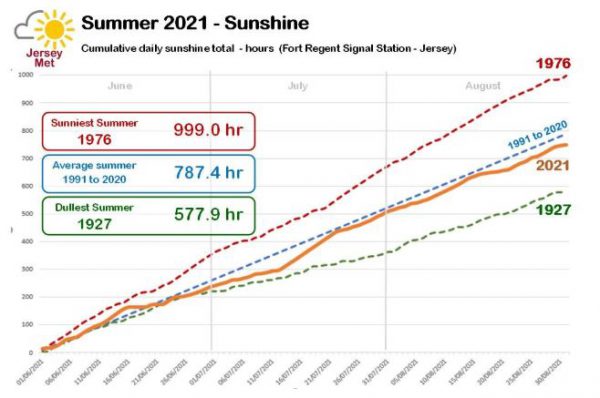
So let’s now have a rather clinical delve into Jersey’s figures for summer 2021 and, whilst we are at it, we can explain away the general vibe of disappointment that seems to have been ringing in the majority of conversations around the Island. The first graph we shall look at is for 2021 summer sunshine hours (yellow line). For context, we have also drawn a green line for our dullest summer on record (1927). Obviously, there’s a relatively small number of people old enough to remember that summer and one has to ask if it would even be possible to remember it, given that it has been outshone by each and every one of the subsequent summers. The red line represents the sunniest summer on record (1976). As this was 45 years ago, anybody under the age of 50, is unlikely to have a clear recollection of that iconic scorcher. However, there are certainly enough people in the right age bracket for the ‘summer of 76’ to still be casually referenced hundreds of times per year on the TV, the radio, in print and in corner-shop conversations.
It’s probably not at all surprising to see that the majority of 2021’s summer sunshine line (yellow) lies closer to the green line than to the red. Although, if you are a little bit disturbed by how dull June appeared to be, then you must bear in mind that these lines represent cumulative sunshine hours, meaning that all summers start at the same figure (zero) on June 1st and it will always take at least a few weeks for the lines to diverge significantly.
The only line I’ve not mentioned so far is the blue line. This represents the current climatological average (the average of all 30 summers from 1991 to 2020). Quite simply, at a glance, if the yellow line is below the blue line, then we can say that the summer has been duller than average up to that point. Likewise, if the yellow line is above the blue, then we can say that the summer has been sunnier than average up to that point. Throughout the month of June, we can see that sunshine hours were pretty close to average for the first fortnight, then things really spruced up in week 3. You can imagine a sports commentator talking us through it:
Weeks 1 and 2… ‘A steady summer so far, Islanders are feeling pretty positive, as we might expect’.
Week 3 (excitedly)… ‘And now the sunshine is smashing it! Islanders are sea-swimming, barbecuing and generally feeling like they’re on holiday, is it going to be as fabulous as last year? Please let it be like last year’.
Weeks 4 to 7… ‘Oh no, what’s going on? It feels like we’ve gone back to March or April, and there’s no end in sight! It’s just one unsettled forecast after another! The frustration is palpable’
Week 8… ‘What’s this? First week of the school holidays and the sunshine is wall to wall! This doesn’t happen very often but I’ve got a good feeling about this, we deserve it after what we’ve had so far’.
Weeks 9 to 13… ‘What?! Was that it?! Surely it’s not autumn already? One week does not a summer make’.
No doubt there will be plenty of people who were actually quite delighted to have eased back on the air-con and the sun-cream. Smouldering in swimwear isn’t everybody’s idea of heaven. However, as meteorologists, we Jersey Met Forecasters attract weather comments / questions / requests left, right and centre, both in and out of work; and I can tell you anecdotally that the near-unanimous popular opinion was that last summer (2020) was simply amazing and this summer was a relative shambles.

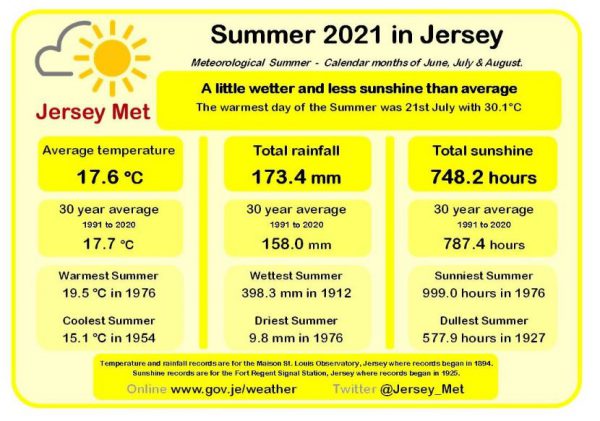
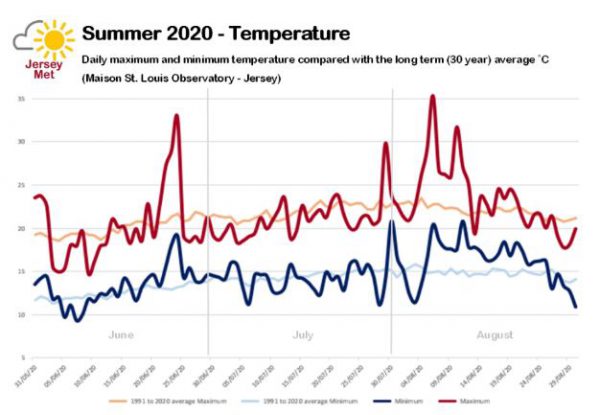
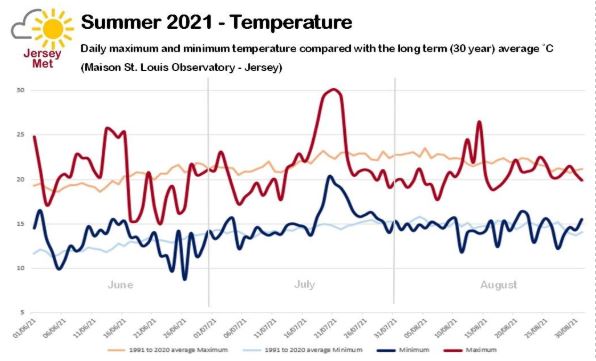
Such emotive voting for last summer in favour of this. However, funnily enough, now that summer is over and all the stats are in, we discover that both summers were very close to average. Looking at the mean temperature first (which includes night and day)… summer 2021 was only 0.1°C below the 30yr average (17.7°C) and summer 2020 was only 0.3°C above that same 30yr average. Yes 2020 was warmer, can’t argue with that, but given that it only ranked as the 14th warmest summer on our records, one has to wonder why it was so memorable?
Rainfall stats are also unremarkable. In summer 2021, Jersey received 15.4mm more than the 30yr average (158mm). But to put that into context, that could be the difference between one or two thundery showers hitting or missing the Island as they wander across the Channel from France to England, and this is quite nicely illustrated by the fact that Guernsey (such a short distance away) were drier than their average by almost the same amount. How about rainfall in 2020? Well, that was only 1mm drier than the 30yr average, which again sounds so ‘plain ordinary’ that it is a wonder why that summer is held in such high esteem by so many Islanders.
The answer is probably fourfold…
- Firstly, summer 2020 is so recent, that almost all Jersey residents can remember it so vividly that they don’t for a moment question whether they’re wearing rose-tinted spectacles
- Secondly, summer 2020 was the first year when a pandemic forced the majority of adults to work from home, school-children to study at home and families to staycate rather than vacate the Island for their holidays. The weather might have only been mildly gorgeous, but there’s no wonder that we thoroughly appreciated it, given that amount of time that so many of us had to mindfully indulge in it
- Thirdly, although summer 2020 was only slightly warmer and slightly sunnier than the 30year average, it was consistently so, with frequent comfortably gorgeous episodes, punctuated only by brief but also comfortable interludes. By contrast, summer 2021 endured really long drawn-out episodes of weather that many people described as autumnal, and these were only punctuated by a couple of quite uncomfortably hot weeks (one in June and one in July) and one very settled but irritatingly windy episode in late August
- Finally, May 2021 was cooler and much wetter than average, whereas May 2020 was much warmer and drier than average, as well as being the sunniest May on record! So even though it was technically spring rather than summer, we all felt as though summer 2020 was blissfully long, as opposed to summer 2021 which only really felt like summer for the odd snatched moment here and there
So, although I’ve only skimmed the surface of all the available data in this blog, it’s been really interesting to investigate why two summers, so close to average that neither of them were anywhere near record-breaking, could be so different according to popular human emotion.


Words by Rob Plummer (Jersey Met – Senior Forecaster), Graphics by Paul Aked (Jersey Met -Manager)
 blog.gov.je