 blog.gov.je
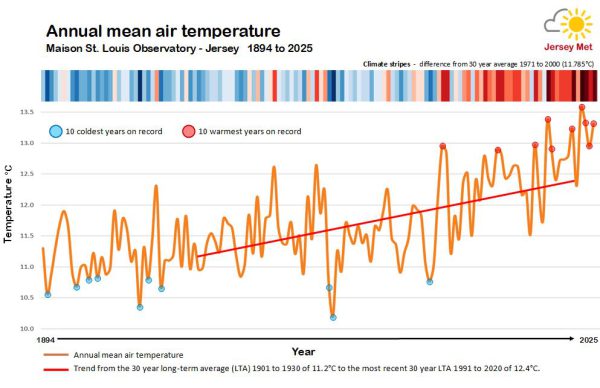
We at Jersey Met can now confirm that 2025 was Jersey’s fourth warmest year on record, with an average annual temperature of 13.3°C; 0.9°C above the 30-year long-term average. Despite a colder end to the year, the year overall was one of the warmest on record for Jersey, which will be reflected in the addition of a further dark red stripe to the Jersey Warming Stripes.
It is important to remember that to calculate the average annual temperature, temperatures from throughout the year, from both the daytime maximum and nighttime minimum are included to give us the overall average figure.
While the rainfall total for the year of 823.6mm fell short of the long-term average by 94.6mm, the sunshine total of 2382.9 hours has confirmed the year to be the fourth sunniest on record for the local Fort Regent Signal Station where records began in 1925.
Monthly and Seasonal temperature
Notably, only two months this year were below their respective monthly average temperature. Individual months saw April the fourth warmest on record, with May being the equal third warmest. Spring as a whole was the warmest since records began. June was the warmest on record, not only recording the hottest day of the year with 33.4°C on 30 June, but also a heatwave of temperatures over 30°C from the 19 to 21. The nighttime minimum on 21 June only fell to 22.1°C, recording a ‘tropical night’, which is when the air temperature remains above 20 degrees. A further daytime maximum of 31.2°C on 13 July gave the total of 4 days in the year to record over 30 degrees. Summer 2025 was the fourth warmest on record and sea temperatures were, on average, the second warmest for the summer months. November was the equal sixth warmest on record.
The lowest temperature recorded through the year was 0.1°C on 3 January, the year is one of only 12 since records began where we have not recorded any days with an air frost — when the air temperature falls below 0.0°C. The total number of ground frosts was 21, well below the long-term average of 45.8 days.
Rainfall and Sunshine
Regarding rainfall and sunshine, January was the wettest on record with the wettest day of the year on the 29, recording a total of 45.4mm of rainfall. March was the eleventh driest and fourteenth sunniest on record, with April and May continuing to be sunny. Spring as a whole was the third driest and fourth sunniest, along with the warmest on record. Eight months of the year brought below average rainfall, despite 2025 having the wettest January, the year’s rainfall as a whole ended 94.6mm below average.
Why do we compare with a 30-year long-term average?
We compare weather records against a 30-year long-term average so that we can make a comparison against the current climate period. These are updated each decade and we are currently comparing with the 1991 to 2020 long-term average dataset. Within the variability of weather we see individual years fluctuate as the weather does, but when we bring together a longer period, in this case 30 years, we can draw conclusions as to the changes in our climate.
Weather vs Climate
It’s important to understand the distinction between weather and climate. Weather is what we experience on a daily, monthly or annual basis, whereas climate is the conditions measured over the longer data period and is how we describe longer-term changes in our weather for a particular location. In meteorology it is normal to use a 30-year period as the Long Term Average. . If we look at the 10 warmest years on record, 9 of these have been since the year 2000.
How does this increase in temperature affect us?
Along with temperature rise, for every degree our atmosphere warms, the atmosphere can hold 7% more moisture, adding to the wetter weather. As a result, we should be prepared for the potential to see more extreme weather events as our temperature rises.
For more information on climate statistics visit: Climate statistics