 blog.gov.je
May was the fifth month in a row in 2024 when Jersey’s sea surface temperature* was higher than the long-term average (LTA), which is the average calculated over a 30-year reference period.
By grouping all five months together, the data shows that the sea temperature in Jersey has been 0.9°C higher than the LTA. Our current reference period for data collection is the 30-year period from 1991-2020.
How do we look at trends in climate data?
We don’t look at any single year in isolation. One year may be particularly warm or particularly cold, and therefore would only reflect what was happening within that year, – not whether this was part of a longer-term trend.
Instead, we look at changes between our long-term average data sets to try and see what’s happening.
Warming trend since the 1960s.
Looking back through these data sets, we do notice a warming trend since the 1960s, with the average 30-year temperature increasing by around 0.2°C every time we move forward by a decade, and there is an overall difference of 0.7°C between the first and the latest LTA reference periods.
There are also some signs that this warming trend may be increasing, because the differences have increased slightly each time we compare a LTA period with the previous period.
These differences were:
0.19°C between the 1961-1990 LTA and the 1971-2000 LTA;
0.22°C between the 1971-2000 LTA and the 1981-2010 LTA;
0.25°C between the 1981-2010 LTA and the 1991-2020 LTA;
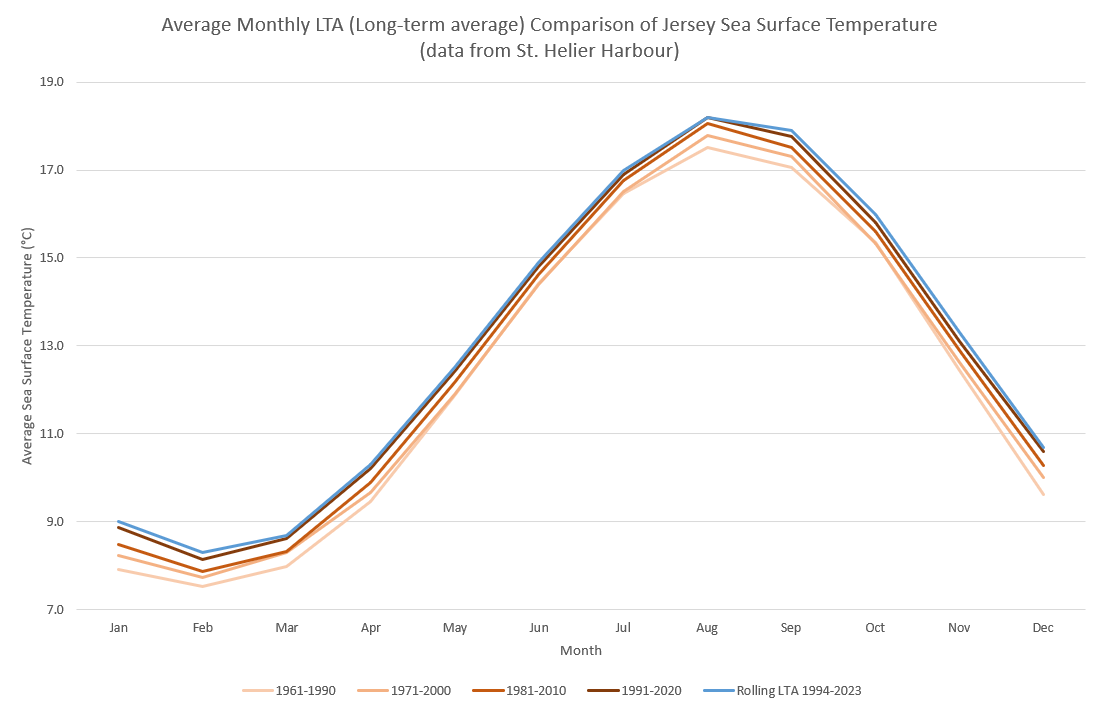
This is shown in the graph below, which compares Jersey’s sea surface temperature for each of these LTA periods, clearly showing the warming trend from each period to the next. Looking across the year, it can also be seen that the largest differences occur around the coldest and warmest parts of the temperature cycle, i.e. at the end of winter and at the end of the summer, with smaller differences in the transitional months.
So, is this trend continuing through the current decade?
If we use a rolling 30-year period average (1994-2023), which includes 2022 – the warmest year on record, for both air and sea temperatures, alongside 2023 which was also much warmer than average, we can see that this trend does indeed continue. This latest rolling 30-year LTA average for the period 1994-2023, shows a change of ~0.1°C, and we’re only a third of the way through the decade. This implies that a >0.3°C increase may well be possible when we transition to the next official LTA data series, which will be 2001-2030.
Global warming?
This picture is part of a wider warming trend which is being seen across much of the globe and has been recently been highlighted in the media by Copernicus data (Climate change: World’s oceans suffer from record-breaking year of heat – BBC News). This is in line with what we would expect to see over the land and sea in a globally warming climate.
*The daily sea surface temperature is calculated by measuring the sea temperature in St. Helier harbour on each high tide and then using the average of the tides for the daily value. This means we’re measuring the temperature of the top few metres of the sea, and not at the surface, which will usually be much warmer on a warm sunny day with little wind. Note – very occasionally a day will only have 1 high tide.