 blog.gov.je
Monthly Economic Note: For a small island, we are lucky enough to be relatively data rich. We have a lot of data, and Statistics Jersey has a programme of work which is delivering more data, different data and better data. This creates a challenge for the economics unit as we look to use this information to understand the story it is telling us about the economy of Jersey. This month’s note looks at the data we have on population, employment and jobs, and the narrative that this data collectively tells us.
Jersey’s economy created an additional 1600 jobs in 2022…
In 2022 the number of jobs increased by 1600 (full-time equivalents) compared to 2021 (we use full-time equivalents to provide a measure of employment that is comparable over time and between countries).
This represents a 3% increase in jobs compared to 2021. As ever, the average masks significant variations: For example, jobs in hospitality (food, drink and accommodation) grew by 12% whilst jobs in banking reduced by 5%.
Chart 1 below shows the change in employment for some sectors. More specifically it shows the change in jobs for those sectors that saw jobs growth in excess of 3% and sectors that saw a reduction in the number of jobs.

… a faster rate of increase in 2022 than the average rate of increase since 2013
Since 2013 the number of jobs in Jersey’s economy has increased by 12%, or an average of about 1% per year. The rate of increase in jobs during 2022 was above average but possibly reflects the final stages of recovery from the shocks caused by Covid. The proportion of jobs that are full-time (as opposed to part-time, zero-hours or exempt) has increased from 72% (Dec 2015) to 77% (Dec 2022) but remains below that of the UK, OECD average and Euro area average.

The share of jobs that are public sector has remained constant at 14%.
The sectoral composition of employment is broadly unchanged…
Unsurprisingly (because the structure of economies and employment rarely changes quickly), the sectoral employment pattern is broadly unchanged (Chart 3 below).
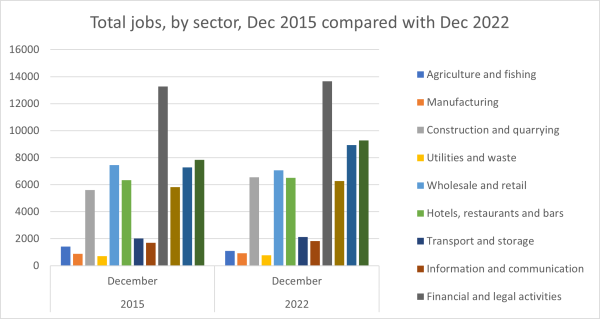
But looking at the numbers in more detail reveals a more nuanced picture. Some sectors – agriculture and wholesale/retail – have seen a fall in the number of FTE jobs – whilst sectors such as construction, transport and education, health and other services have seen strong growth.

Looking at the share of jobs by sector, construction has seen a 1ppt increase in its share of jobs as has the public sector, whilst education, health and other services has seen a 2ppt increase. Conversely the share of jobs in financial services has fallen by 1ppt and the share of jobs in wholesale and retail has fallen by 2ppt.
Jersey is at full employment…
Jersey enjoys a high employment rate. In 2021 (Census), 81% of those aged 16-64 were in work (16-64 is the internationally agreed definition for working age and using this definition enables statistics to be produced that can be compared over time and between countries. This definition does not imply that those aged 65+ should not work).
This employment rate is high and significantly above that of the UK (2021 employment rate was 75.1%), the average for countries in the Euro area (67.9%) and the average for OECD countries (67.7%). Furthermore, the employment rate of women on Jersey was also comparatively high at 77% (2021) compared to 72% in the UK.
In addition to a high employment rate, Jersey also benefits from a low inactivity rate (the proportion of working age population that is not working and not looking to work). Jersey’s inactivity rate was 16% (2021) of which 5ppt was young people in education. By comparison the UK’s inactivity rate was 21%. A high employment rate coupled with a low inactivity rate means that Jersey is effectively at full employment – all those wanting and able to work are in work.
New experimental statistics from Statistics Jersey provide more information on employment, splitting employment and jobs for the first time. By these statistics, 410 more people were in employment in 2022 compared to 2021, whilst the number of jobs increased by 280. The proportion of people with two or more jobs decreased slightly from 7.4% in 2021 to 7.1% in 2022.
The statistics also provide a breakdown of the employment by age, allowing us to estimate an age specific employment rate. In 2022, the employment rate was highest for those aged 30-34 at 86.7%, though the 60-64 age group experienced the greatest increase in the employment rate, up by 1.1 percentage points.
… but at the same time a large number of vacancies exist
Alongside high employment, low unemployment and low levels of inactivity, Jersey has a high number of job vacancies. Typically, job vacancies are seen as evidence of labour shortages, but in the case of Jersey it might be better to view them as evidence of skills shortages. Jersey has suffered from declining productivity for a number of years.
Declining productivity means that an increasing number of workers is needed to produce the same output (output as measured by gross value added). In 2020, 1.7 workers were needed to produce the same value of output produced by 1 worker in 1999.
; Finance and non-finance sectors, 1998-2022")
… improving skills will both increase productivity and will alleviate labour shortages.
At least part of the explanation for Jersey’s declining productivity lies in skills shortages. Improving the skills of the workforce and adopting new ways of working will increase productivity.
One puzzle remains though …
During 2022 Jersey’s economy gained an additional 1600 full-time equivalent jobs. The economy was already at full employment and so it would have been reasonable to expect to have seen some population growth accompanying the growth in jobs. However, experimental statistics produced by Statistics Jersey suggest that the 2022 population was unchanged from 2021, i.e., there was no population growth.

This leaves us with a puzzle to solve. How have the additional 1600 full-time equivalent jobs been filled? The overall population numbers are the balance between births and deaths and flows of people moving to live on Jersey and those leaving to live elsewhere. Whilst this balance was effectively zero, there was a net increase to Jersey of people or working age and a net outflow of people of non-working age. Could this explain how the additional 1600 FTE jobs were filled? In short, no. There was a net increase of approximately 180 people of working age which isn’t sufficient to explain the growth in filled jobs. The recently released experimental statistics indicate that the employment rate edged up slightly, by 0.5 percentage points, with more older people in work – potentially having returned to work after retiring. However, they also indicate that fewer people are holding multiple jobs, so that can’t explain the large increase in new jobs. More work is needed to solve this puzzle.
As an aside, we now know more about Jersey born people living in the UK
Like Jersey, the UK conducted its own census in 2021. This contains lots of information about England and Wales’s Jersey diaspora – the population of individuals who were born in Jersey but now reside in England or Wales. In March 2021, between 6,000 and 12,000 Jersey-born individuals resided in England and Wales (depending on how you count respondents who stated they were born in the Channel Islands without otherwise specifying). This is equivalent to around 10% of Jersey’s on-Island population, and nearer to 20% of Jersey’s native-born population. This reflects the strong links between Jersey and the UK: Jersey’s 2021 census found that nearly 30% of the Island’s population was born in the UK.
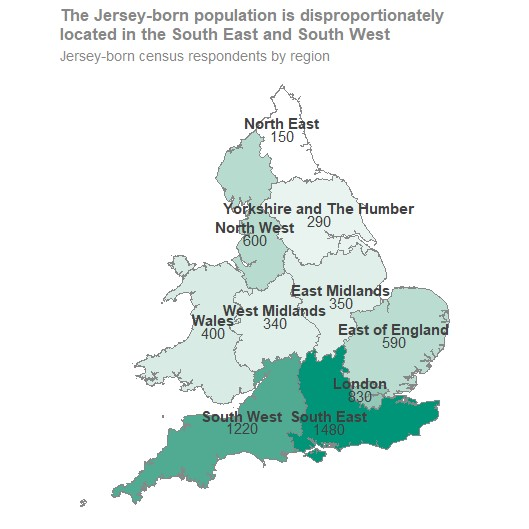
The data also show that Jersey-born individuals are disproportionately clustered in the South East and the South West of England. While this is unusual compared to other migrants in the UK, who tend to be most commonly located in London, this likely reflects the regions’ proximity to Jersey and air and sea links. The Jersey diaspora has deep roots, with more than two thirds having first arrived in the UK at least before 2010 and is less likely to be economically active (e.g., more likely to be retired). On average, Jersey-born residents of England and Wales are more highly qualified than the general population, and more likely to be students (around one in eight).
Although the pandemic-disrupted year of 2021 was unusual, the UK census data make it clear that there is an established Jersey diaspora in England and Wales. While these individuals (not all of whom necessarily hold full residency rights) don’t contribute directly to Jersey’s economy, Jersey benefits in several ways from its population abroad. The presence of Jersey-born families, students, entrepreneurs, employees and retirees in the UK helps to boost awareness of Jersey as a place to visit and do business, creating investment and business opportunities, as well as facilitating the transfer of skills and knowledge from the UK to Jersey – not least from the thousands of students who have gone to the UK for higher education.