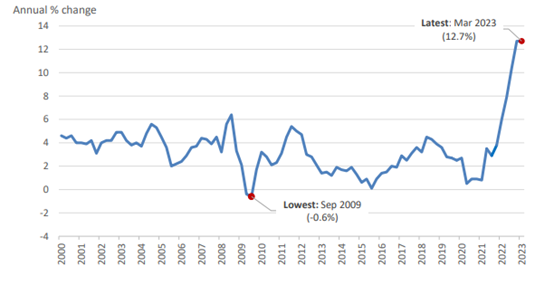
Statistics Jersey has published the latest inflation data for Jersey. This showed that the annual rate of inflation was unchanged at 12.7%.
This is relatively good news for Jersey – inflation, whilst still high, had not increased. The Fiscal Policy Panel’s Spring assumptions forecast inflation to peak in Q1 2023 and then to start falling. The question we’re considering is whether RPI inflation has peaked … or whether there is more to come. In this note, we will share some of our thinking and the data and evidence we use.
What do we mean by inflation…
Inflation is a measure of the rate at which prices are increasing or decreasing. There are different ways of measuring inflation with measures including the Retail Prices Index (RPI) (Jersey’s headline measure) and Consumer Price Index (CPI) (UK’s headline measure). Both these measures calculate the change in prices in “a typical basket of goods and services”, which in turn are based on spending patterns of households as collected by surveys. However, it is important to note that Jersey’s RPI and the UK’s CPI are not directly comparable.
…and should we care about it?
Inflation affects us all. It affects the prices we pay and can influence our decisions about what to buy and when to buy. A little bit of inflation is considered – at least by economists – to be helpful and so central banks are targeted to keep inflation at/around a small figure (e.g., 2%). But high and unstable inflation is not good – it causes uncertainty (it is hard to plan when prices are changing), it can lead to less investment (both because of uncertainty and because under high inflation spending/investing tomorrow is cheaper than spending/investing today) and it can destroy an economy. When you consider major economic collapses throughout history, often hyper-inflation (very high levels of inflation) is either a cause or a symptom.
What drives inflation…
Inflation is a measure of the rate of change in prices which in turn reflect changes in costs of production (raw materials, labour, capital/machinery etc.). Changes in these costs are largely driven by imbalances between supply and demand. Rising prices indicate that demand (in at least some part of the production chain) is exceeding supply; falling prices indicate that supply exceeds demand. Sometimes a change in price can arise because of a temporary change in demand or supply – e.g., the price of strawberries increases after heavy rain destroys part of the crop. Other times – such as now – inflation can be more widespread; the conflict in Ukraine has directly affected the supply of some commodities (e.g., wheat) and the subsequent sanctions on Russia have affected the supply of other commodities (especially oil and gas). The sudden reduction in supply has driven up prices. Households across Europe – but not in Jersey(!) – have faced very high costs to heat and light their houses; the same high energy costs are driving up the costs of production of the majority of goods and services, especially food. This had led to rapidly rising prices in the UK and in Jersey, and inflation.
…and has it peaked?

Figure 1: Change in Jersey’s inflation (RPI) (Source: Statistics Jersey)
The three questions that many economists – including the team in GoJ – are trying to answer are: has inflation peaked? How quickly will it fall? How is the economy performing?
To answer the first question, we need to understand what is in the RPI basket of goods and then consider what is happening and likely to happen to the prices of these goods.
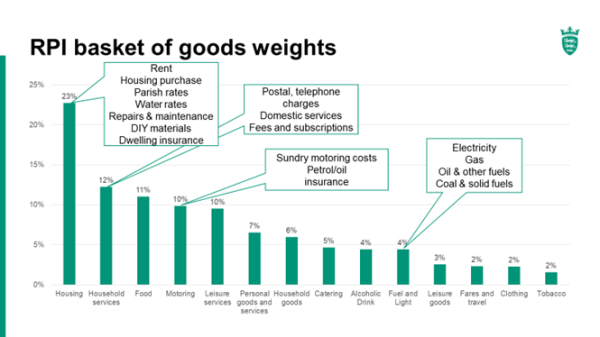
Figure 2 shows the categories of goods and services included in the Jersey RPI basket of goods. It also shows their weighting:

Housing costs are the biggest component of RPI. This is not surprising: most of us spend the biggest chunk of our income on rent, mortgage repayments and associated housing costs. This category includes a number of items, with housing purchase being the largest element. Housing purchase – broadly mortgage costs – is calculated using the change in the Bank Rate (set by the Bank of England). At any point in time we can estimate, using forecasts of the Bank Rate, whether housing costs will contribute more or less to RPI compared to the previous period. It is important to note that the way RPI is calculated in Jersey means that interest rate rises are included in the rate as they happen, but they might not actually impact on households, particularly if they have a “fixed rate” mortgage.
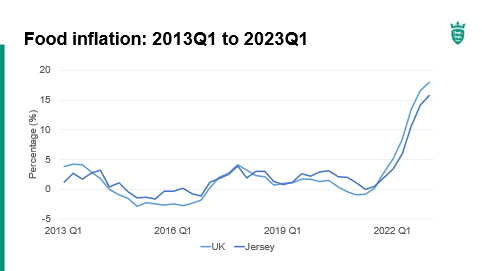
In a similar vein we can estimate the change in the other categories using a mixture of published tariffs (e.g., Jersey Telecom, JE, etc.), futures prices (oil, fuel) and data from the UK (most of the food bought in Jersey is imported from the UK and so we can use monthly CPI data to estimate future Jersey food prices).
Forecasting is difficult…
We are very fortunate in that we have the expertise and wisdom of Jersey’s Fiscal Policy Panel (FPP) to draw on; in fact, it is the FPP who are responsible for producing forecasts for Jersey (in the same way the OBR does in the UK). Earlier this year, the FPP forecast that RPI would peak in Q1 2023 at 12.8% before falling steadily.
The question we are now asking is whether inflation has peaked at 12.7% in both Q4 2022 and Q1 2023?
On balance we think it probably has – but uncertainties remain. Inflation in the UK is not coming down as quickly as the Bank of England had forecast. This creates two upside risks to Jersey’s RPI. The first risk is that the Bank of England’s Monetary Policy Committee may, because of worse than expected UK inflation figures, vote to increase the Bank Rate by 0.25 percentage points when it meets in May.
If this happens it will feed through to Jersey’s RPI. The second risk comes from imported food price inflation. Food price inflation in the UK was expected to fall but so far it has remained stubbornly high. Jersey food prices tend to rise with UK food prices and so there is a risk that food inflation could remain high (or increase) on Jersey and contribute to high(er) RPI inflation.

Other risks to prices exist too. Evidence – both survey and anecdotal – points to rising prices in Jersey. Latest results from the Business Tendency Survey show that businesses continue to face higher input costs (including labour) and are passing at least some of these higher costs on via higher product prices. Anecdotally, we are hearing of price rises across a range of goods and services. Of course, anecdote is not data, and survey answers don’t give us estimates of the size of price changes and so judgement is needed. We will keep monitoring this – and are fortunate that Statistics Jersey have offered to include additional questions into the Business Tendency Survey which will ask respondents about their expectations of future input and product prices.
… and.
In support of the FPP and forecasters more generally, it is worth noting that forecasts are best estimates based on best available evidence at a point in time. There is lots of uncertainty in forecasting and especially economic forecasting. There is a saying that America sneezes and the rest of the world catches a cold: that is to say that small (or relatively small) unexpected changes in one part of the global economy spill over to other economies and can create big effects.
That said, Jersey’s economy seems to be coping in spite of high inflation.
To finish on a positive note, despite the impacts on households the Business Tendency Survey and other data (e.g., Actively Seeking Work numbers ) all suggest Jersey’s economy is performing OK. Whilst higher interest rates are not good news for mortgage holders or those with debt, they are good news for the finance sector as they increase the potential margins between deposits and loans and thus should generate higher profits in the finance sector. The GVA/worker statistics should show an uptick – but users of these statistics need to be aware that whilst there may be some genuine productivity, much of the apparent uptick in productivity will be simply higher profits driven by higher interest rates.
 blog.gov.je